
Insider Tips - Weekly Stock Market Report - Week October 26, 2026
Insider Tips — October 26, 2026
Red Signals, AI Weakness, and Emerging Leaders
The market is flashing a defensive signal this week. Broad-market indicators have turned red, technology shares remain under pressure, and several former leaders are struggling to defend important price levels. Yet the weakness is not universal. Selected stocks in healthcare, consumer technology, and energy are showing relative strength, giving investors a useful watchlist for a more favorable environment.
Mark Yegge’s central message is straightforward: market conditions matter as much as individual stock selection. Even an attractive chart can fail when the wider market is declining. For investors using covered calls, collecting premium does not remove the need to protect the underlying shares.
The immediate opportunity is to identify genuine accumulation without rushing to buy. The immediate risk is treating a temporary bounce as a durable recovery. This week calls for patience, clear exit rules, and the emotional discipline to hold cash when setups lack confirmation.
Technical Analysis
A Split Market, With Red in Control
Mark’s timing system shows the Vanguard Total Stock Market ETF (VTI) in red for five consecutive sessions. The Nasdaq-focused Invesco QQQ Trust (QQQ) is also red, emphasizing continued pressure on growth and technology. The SPDR S&P 500 ETF (SPY) has shifted toward yellow, suggesting that selling intensity may be easing, but not that a new uptrend is established.
The Dow Jones Industrial Average is the relative exception, retaining a green signal despite a weak session. That divergence matters: some pockets are holding up, but broad participation is missing. Mark’s assessment remains that the overall market is red.
Moving averages provide another reality check. Stocks above their 50-day and 200-day lines have stronger technical foundations than those repeatedly losing support. Breakouts also need convincing volume. Heavy buying near a pivot can reveal demand; repeated failed breakouts or high-volume declines signal that sellers may have control. No single indicator should override the broader picture.
Market Trends I’m Calling Out
AI Enthusiasm Meets Price Discipline
Nvidia, SanDisk, IREN, and the memory-focused DRAM ETF illustrate how quickly market favorites can fall out of leadership. Exciting business prospects do not guarantee healthy entry points. When momentum breaks, the size of a company’s long-term opportunity matters less to an immediate trade than support levels, volume, and the market environment.
Healthcare and Energy Offer Alternatives
Medical instruments and supplies rank strongly in Mark’s industry-group review, with Avantor demonstrating notable accumulation. Meanwhile, the United States Oil Fund is near a breakout zone. The contrast shows why traders should look beyond last quarter’s popular sectors. Oil, however, carries an additional geopolitical risk: Middle East developments can move prices suddenly.
Covered Calls Still Require Downside Controls
Option premium is income received in exchange for an obligation, not insurance against a falling stock. Mark favors reviewing weaker holdings when conditions turn yellow and becoming more defensive when the market turns red. Predetermined circuit breakers, smaller position sizes, and avoiding forced entries are more valuable than trying to capture every possible premium.
Individual Stocks (What I’m Seeing)
Roku (ROKU): Watch the Pivot
Roku is holding above its 10-week and 40-week averages while consolidating around a $159.99 pivot. Weekly volume was running approximately 96% above its 10-week average in Mark’s review, an encouraging demand signal. Its third-stage base and the red market argue for confirmation rather than an immediate entry.
Apple (AAPL): Relative Strength Persists
Apple is climbing the right side of a cup formation and hovering near a potential buying zone. Its Genius Strength reading of 79 approaches Mark’s preferred 80 threshold. The chart is constructive, but stronger market breadth would make a breakout more persuasive.
Nvidia (NVDA): Breakouts Keep Failing
Nvidia attempted several breakouts from a cup-with-handle formation before retreating. It now sits below its 50-day average but above its 200-day line, an uncomfortable middle ground. Mark identifies roughly $207–$208 as potential support, not a guaranteed floor. Selling pressure remains the concern.
SanDisk (SNDK): Protect Gains Early
SanDisk has suffered a steep correction after an extended advance and is testing its 200-day moving average. Mark views that line as a potential stabilization point, while warning that a failure could expose lower support. Its reversal illustrates why exits should be planned before an emotional selloff begins.
IREN (IREN): A Damaged Momentum Chart
IREN’s earlier surge from roughly $5 toward $75 gave way to intense selling. In Mark’s chart review, the stock fell toward $25 and broke through a $28.92 swing level. A Genius Strength reading of 4 underscores the deterioration. A fallen price alone is not a buy signal.
Gold (GLD): No Automatic Safe Haven
SPDR Gold Shares has lost significant momentum in the chart discussed. Mark sees a weak structure rather than a convincing recovery. Gold may diversify some portfolios, but its price can still fall sharply; protective labels are no substitute for examining the trend.
Bitcoin (IBIT): Better, but Unconfirmed
The iShares Bitcoin Trust is forming a cup-with-handle structure above its 50-day average. Mark also highlights a golden cross, when the 50-day average rises above the 200-day. Those signals look more constructive than GLD, although Bitcoin’s volatility calls for extra caution.
Cleveland-Cliffs (CLF): A Fresh Base
Cleveland-Cliffs is sitting near a potential buy zone after forming a new cup-with-handle base. That cleaner structure makes it worth monitoring. The challenge is timing: favorable individual patterns have lower odds of following through when the wider market remains red.
Tesla (TSLA): Recovery Needs Time
Tesla is trying to build the right side of a cup but remains well below the approximately $453 prior high cited by Mark. Its relationship with the 200-day average is unsettled. Pullbacks appear to be contracting, yet the pattern has not produced a confirmed breakout. Business ambitions should not replace chart evidence.
SpaceX (SPCX): Consolidation, Not Leadership
Following volatile trading around its financial update, SpaceX is moving around its 50-day average within a developing consolidation range. Mark sees neither decisive strength nor a complete breakdown. The next directional move, supported by volume, matters more than speculation about its long-term prospects.
JPMorgan Chase (JPM): Rates Complicate the Outlook
Higher interest rates can reduce the market value of banks’ existing bond holdings. JPMorgan is trading toward the lower half of a consolidation range, with a Genius Strength reading near 50. Mark sees limited technical reason to pursue the banking trade until relative strength improves.
Avantor (AVTR): Institutional Demand Stands Out
Avantor, part of the leading medical instruments and supplies group in Mark’s screen, has climbed through resistance on encouraging volume. His analysis shows 12 demand days against zero supply days. That accumulation profile distinguishes it from the market’s weakest charts, although an extended advance can still pull back.
Marathon: Oil Momentum Needs Monitoring
Marathon approached a bull-flag breakout but failed to sustain its initial move. Mark keeps it on the watchlist rather than assuming another advance. Energy trades require awareness of geopolitical developments as well as technical support and resistance.
Memory ETF (DRAM): Sector Weakness Broadens
The Roundhill Memory ETF is also struggling, suggesting SanDisk’s problems are not wholly company-specific. Mark’s reading of the memory group remains cautious. Investors should look for improved price structure and demand before deciding that a sector-wide decline has ended.
United States Oil Fund (USO): Relative Strength in Energy
USO is positioned in a breakout zone and carries a Genius Strength score of 98 in Mark’s platform. It is among the more constructive instruments examined this week. Still, strength does not eliminate overnight headline risk or justify ignoring exit rules.
Key Takeaways
- Respect the red signal. VTI and QQQ remain weak; SPY’s yellow reading is not a confirmed recovery.
- Protect the underlying position. Covered-call premiums cannot fully offset a major stock decline.
- Avoid chasing former leaders. Nvidia, SanDisk, and IREN show the cost of ignoring deteriorating price action.
- Study relative strength. Roku, Apple, and Avantor deserve monitoring without automatic buying.
- Watch sector rotation. Medical supplies and oil are behaving differently from AI-linked stocks.
- Demand confirmation. Look for sustainable breakouts, healthy volume, and improving market breadth.
Current Market Condition
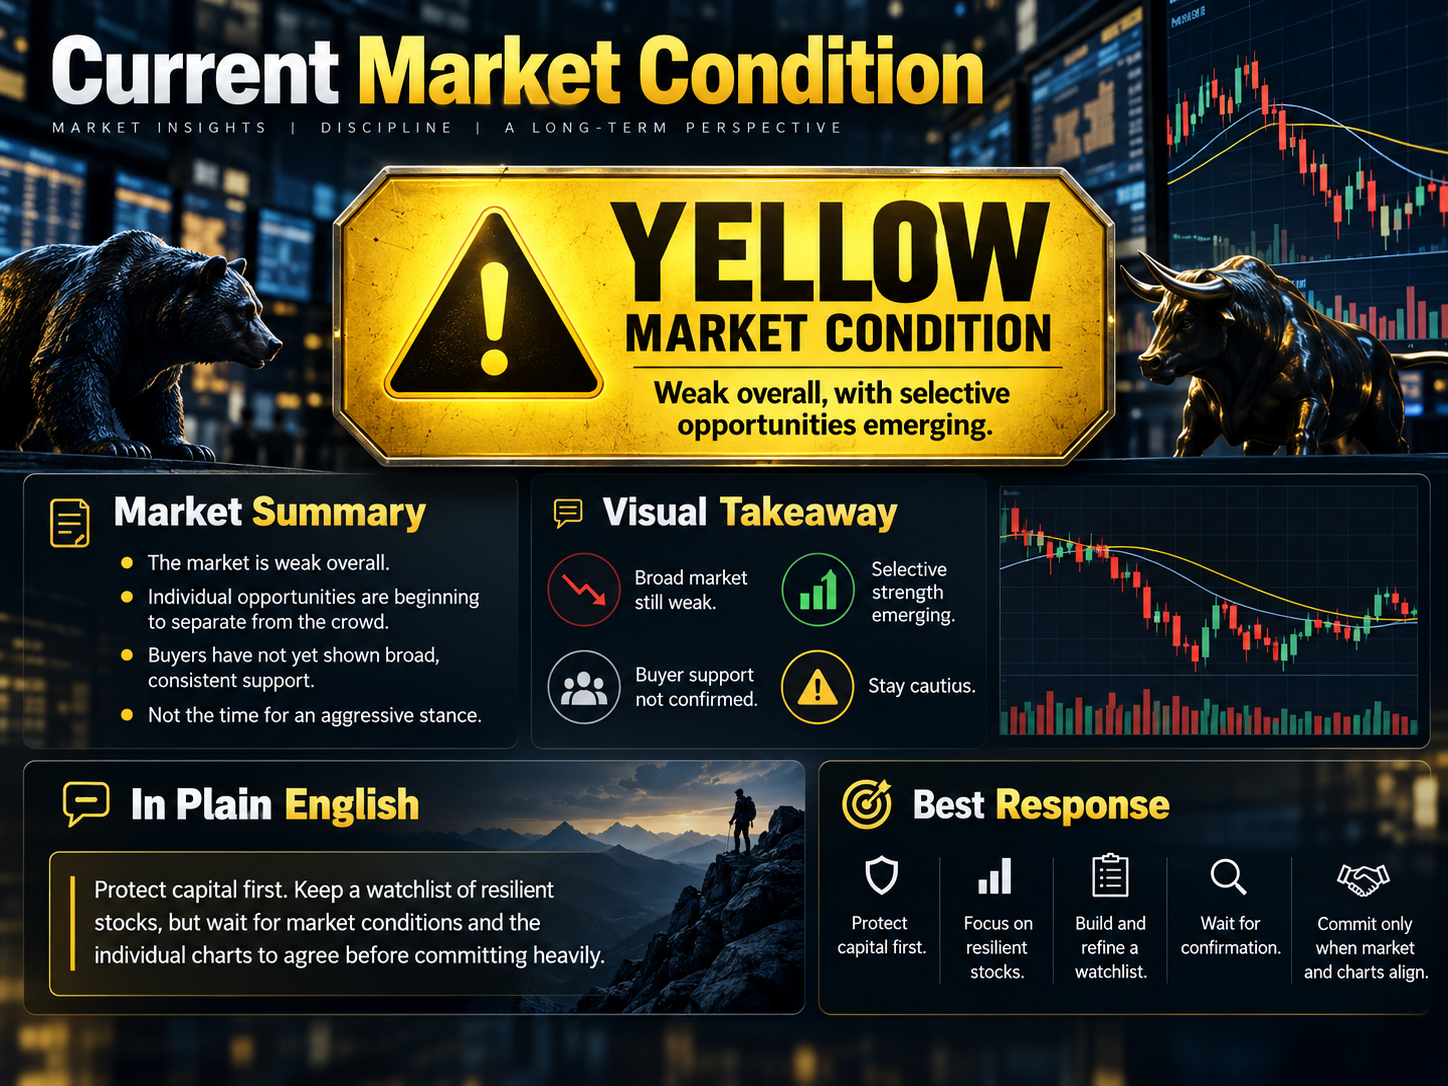
The market is weak overall, but individual opportunities are beginning to separate themselves from the crowd. Buyers have not yet demonstrated the broad, consistent support needed for an aggressive stance.
Protect capital first. Keep a watchlist of resilient stocks, but wait for market conditions and the individual charts to agree before committing heavily.
Conclusion
The objective in a difficult market is not to predict the exact bottom. It is to stay flexible enough to respond when evidence changes. Cash can be a legitimate position, and passing on a questionable trade can be as valuable as identifying a promising one.
Mark’s approach emphasizes chart confirmation, emotional control, and predefined risk limits. Those principles are especially important for income investors, whose focus on collecting premiums should never obscure the possibility of capital losses. Prepare now so that stronger conditions can be approached with a plan rather than a reaction.
Stock Tips This Week

Cheesecake Factory Stock Analysis: A Double-Bottom Setup and Covered Call Strategy
In this video… Mark examines Cheesecake Factory (CAKE), which earns a Genius Strength score of 98 and is developing a double-bottom base near a $115.88 pivot. He weighs modest sales growth against stronger earnings measures and demonstrates an in-the-money $110 covered-call example. The central lesson is that premium income, fundamentals, and a promising chart still require careful timing when the overall market is red.

Cybersecurity Alert: PHP Risks, AI Threats, and the Investment Opportunity
In this video… Mark discusses security risks affecting PHP-based websites and warns that convincing-looking links or HTTPS connections do not guarantee a site is legitimate. Artificial intelligence can accelerate both vulnerability discovery and defensive responses. He also considers why heightened security needs could draw investors’ attention to cybersecurity companies, while emphasizing practical precautions over speculation.

Cybersecurity Stocks to Watch: Four Charts in a Red Market
In this video… Mark compares Fortinet, Appian, Qualys, and Okta using breakout patterns, relative strength, moving averages, and trading volume. Fortinet’s earlier volume-backed move contrasts with less convincing recent action, illustrating why the quality of a breakout matters. Even when cybersecurity has a compelling industry story, individual charts and a red overall market determine whether risk is justified.

Covered Call On Dividend Aristocrats For Consistent Monthly Premium
In this blog… Mark explores combining regular dividends from established Dividend Aristocrats with monthly covered-call premiums. He emphasizes moderate implied volatility, institutional support, liquid options, and selecting strikes with ex-dividend dates in mind. The approach offers two potential income streams, but early assignment and declines in the underlying shares still require active management and circuit breakers.

Covered Call On Small Caps Vs Large Caps Premium Yield Comparison
In this blog… Mark explains why higher implied volatility can make small-cap covered-call premiums more attractive than those on large-cap stocks. That extra yield compensates investors for wider price swings, possible overnight gaps, and thinner liquidity. He describes large caps as potential core holdings and smaller, carefully sized positions as satellites for investors able to manage additional risk.
