
Nvidia Stock Selloff: Key Support Levels and Market Risks
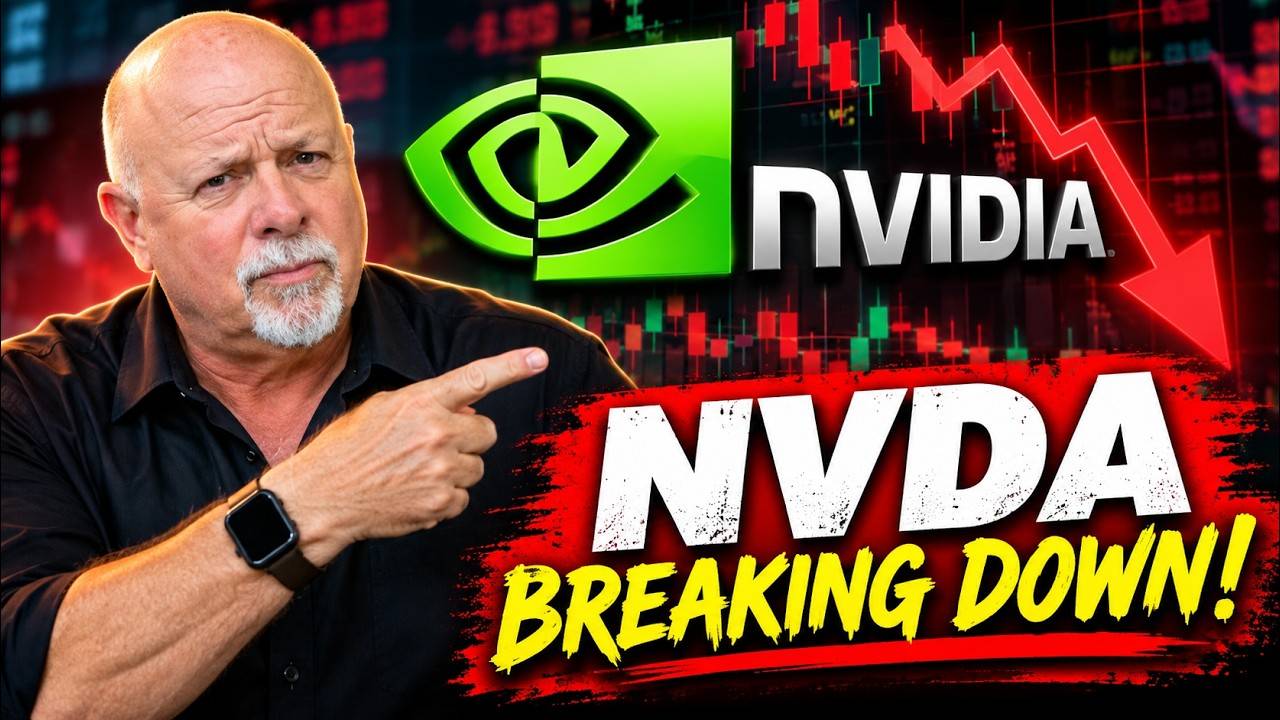
Nvidia Stock Selloff: Key Support Levels and Market Warning Signs
Nvidia (NVDA) has been one of the market's most closely watched technology leaders. But when a leading stock begins losing momentum, it can become an important warning signal for the broader market.
In his latest market analysis, Mark Yegge examines Nvidia's weakening technical picture, the shift toward caution in his market timing indicators, and the movement of investor capital from aggressive technology stocks toward bonds.
With Nvidia breaking below its 50-day moving average and selling pressure building, Mark explains why protecting capital, respecting technical signals, and waiting for stronger setups may be more important than attempting to predict the next rebound.
Key Takeaways
1. Nvidia Flashes Red
Nvidia's stock timing indicator shifted from yellow to red, suggesting weakening momentum and increased downside risk.
2. The Market Turns Cautious
The broader market timing indicator moved to yellow, signaling an environment that is less favorable for aggressive stock purchases.
3. Critical Support Is Approaching
Mark identifies potential support near $208.93 and $207.02, with the $200 area becoming relevant if selling intensifies.
4. Investors Are Reassessing Risk
Technology stock weakness and renewed interest in bonds suggest a defensive shift in investor positioning.
5. Income Still Requires Protection
Covered-call premiums can generate income, but they do not eliminate the risk of substantial declines in the underlying stock.
Nvidia Turns Red as the Market Shifts to Yellow
One of the first things Mark evaluates is the relationship between individual stock strength and the overall market environment.
At the time of his analysis, the Cash Flow Machine market timing indicator had recently shifted to yellow, signaling caution. Nvidia's individual stock timing indicator had also deteriorated, moving from yellow to red.
That distinction matters. A yellow market does not necessarily mean a major decline is inevitable. Instead, it suggests that the conditions supporting aggressive buying have weakened.
Nvidia's red signal points to a more pronounced deterioration in its individual momentum. After previously enjoying a strong upward trend, the stock began displaying signs of sellers taking control.
Mark's Market Interpretation
A yellow market is a reason to reduce aggression, while a red stock timing signal calls for greater attention to downside risk. The objective is to follow the probabilities rather than anticipate an uncertain reversal.
Mark explains that he exited his own Nvidia position after its timing indicator turned red. He emphasizes that this was a decision based on his trading plan and risk tolerance, not a recommendation that every investor should take the same action.
Nvidia's Technical Breakdown: What the Chart Is Saying
Nvidia had developed an attractive technical structure, including a cup-with-handle formation and what Mark's pattern recognition system classified as a ripening base.
Although the setup appeared promising, the breakout lacked sufficient buying volume to establish strong conviction.
Volume plays a central role in Mark's analysis. A stock moving above a buy zone without meaningful institutional participation can struggle to sustain its advance.
Mark notes that even properly formed breakouts can fail. He cites an approximate 40% breakout failure rate as a reminder that favorable patterns do not eliminate risk, especially when broader market conditions are unsupportive.
The 50-Day Moving Average Break
After losing momentum, Nvidia initially attempted to recover from its 50-day moving average. However, the rebound did not attract the buying volume Mark wanted to see.
Selling subsequently increased, pushing the stock below that important technical reference point. A further gap lower strengthened the near-term bearish signal.
According to Mark, the combination of failed breakout attempts, weakening momentum, and a break below the 50-day moving average suggests that the stock may need additional time to establish a durable bottom.
Genius Strength and Momentum Are Weakening
Another concern is the deterioration in Nvidia's Genius Strength indicator, a measure Mark uses to evaluate relative strength and momentum.
As that indicator declined, Nvidia moved closer to the system's sell zone, reinforcing the caution already visible in its price action.
Mark also observed that sellers had dominated much of the recent trading activity, with only one buying day among the preceding eight sessions in the chart he reviewed.
Nvidia Stock Price Levels: Support, Resistance, and Rebound Scenarios
Rather than trying to predict an exact bottom, Mark identifies technical levels that could help determine whether Nvidia finds support or continues declining.
These are technical reference points from Mark's analysis, not current price targets or forecasts.
Mark explains that the volume accompanying any test of support will be important. Lower selling volume could improve the possibility of a rebound, while sustained heavy selling would indicate that downward pressure remains significant.
Even if Nvidia rebounds, one positive session would not necessarily confirm that the correction has ended.
Why Money Is Rotating From Technology Stocks Into Bonds
Nvidia's weakness is not occurring in isolation. Mark points to selling across several prominent technology names, including SanDisk and Dell, alongside pressure on the Nasdaq-focused QQQ ETF.
In his interpretation, part of this movement reflects investors reducing exposure to aggressive growth stocks and shifting capital toward assets traditionally perceived as more defensive.
Bonds become an important consideration when their available yields offer investors an alternative to accepting stock market volatility.
Mark discusses bond yields in the approximate 5.2% to 5.4% range during the period he is analyzing, as well as a notable change in bond market behavior.
He describes this as a potential risk-off rotation, in which investors move away from market leaders that have experienced substantial advances and seek relatively defensive opportunities.
Understanding the Rotation
When investors become more cautious, former market leaders may experience selling even without a fundamental change in their long-term business prospects. Capital flows, relative strength, and market sentiment can all influence short-term price behavior.
Although Treasury securities are commonly viewed as relatively safe investments, Mark expresses skepticism about treating them as entirely risk-free. Bonds also carry risks, and their prices can fluctuate as yields change.
His broader message is that shifts in investor appetite for risk can have significant consequences for technology stocks and the market indexes they influence.
Why a Stock Needs Time to Build a Bottom
One of Mark's central trading lessons is that a declining stock rarely establishes a sustainable recovery simply because it has experienced several difficult sessions.
In many cases, a proper bottoming process takes time.
A stock may initially rebound, encounter resistance, revisit its lows, and then move sideways while buyers and sellers establish a new balance.
This process helps determine whether selling pressure has diminished enough for buyers to regain confidence.
Mark is particularly interested in seeing constructive sideways price action, improving momentum, and stronger buying volume before considering another entry.
He also notes that price gaps can eventually be filled, but that possibility alone is not a reason to assume an immediate recovery.
The Trading Lesson
The goal is not to identify the absolute lowest price. It is to recognize when selling pressure may be ending and wait for a more favorable entry supported by the chart, the stock's timing signals, and the broader market.
Covered-Call Income Still Requires Downside Protection
At Cash Flow Machine, Mark emphasizes income generation through strategies such as covered calls. His philosophy centers on pursuing consistent opportunities rather than relying on unusually large stock price gains.
However, receiving options premium does not remove the risk of owning the underlying stock.
For example, an investor collecting 1% or 2% in premium income over a week could still experience a negative overall result if the underlying shares decline significantly.
A 3% stock decline in a single trading session can quickly outweigh much of the premium collected.
That is why Mark uses what he calls circuit breakers: predetermined risk-management levels intended to limit exposure when a position moves against the trading plan.
His objective is to protect capital during unfavorable conditions, allow the selling process to develop, and reconsider entries when price action and timing indicators improve.
Within the Cash Flow IQ framework, Mark also refers to more defensive, in-the-money covered-call positioning as a Fortress Trader approach when conditions call for greater caution.
The broader principle remains the same: income generation and downside risk management must work together.
What Nvidia Traders Should Watch Next
Mark's analysis highlights several developments that could help traders evaluate whether Nvidia's weakness is stabilizing or continuing.
1. Nvidia's Stock Timing Signal
Watch for the current red signal to improve toward yellow or green, potentially indicating a more constructive technical environment.
2. The 50-Day Moving Average
Monitor whether Nvidia can recover toward its previously identified moving average near $222 and whether any rebound can be sustained.
3. Support Around $208–$207
Observe how the stock behaves near its identified swing points and whether selling pressure begins to diminish.
4. Buying and Selling Volume
Evaluate whether rebounds are supported by stronger buying interest or whether high-volume selling continues to dominate.
5. Nasdaq and Bond Market Behavior
Watch for continued weakness in major technology stocks and further indications that investor capital is shifting toward defensive assets.
6. Evidence of a Bottoming Process
Look for sideways consolidation, successful support tests, and improving momentum rather than relying on a brief rebound alone.
The Bottom Line: Respect the Trend, Protect Your Capital
Nvidia's technical weakness illustrates an important principle of disciplined investing: even leading stocks can experience significant selling pressure when market conditions become less favorable.
With Nvidia's stock timing indicator turning red, the broader market moving to yellow, and technology shares experiencing renewed pressure, Mark believes caution is appropriate until the technical picture improves.
A rebound remains possible, particularly if Nvidia begins stabilizing near its identified support levels. However, Mark emphasizes that a sustainable recovery will likely require evidence of a genuine bottoming process and renewed buying confidence.
For traders using covered calls or other income strategies, the lesson is equally important: generating premium income does not replace the need for disciplined position management.
The objective is not to predict every market move. It is to recognize changing conditions, manage downside exposure, and act when the probabilities become more favorable.
Want to Learn How We Generate Income Regardless of Market Direction?
Discover the Cash Flow Machine approach to covered-call income, stock selection, and risk management. Watch our free masterclass to learn how Mark Yegge approaches generating income while navigating changing market conditions.
Watch the Free MasterclassEducational strategies. No guaranteed income or investment results.
Serious Investors Join Us Inside Elite
Take your investing education further with the Cash Flow Machine Elite program. Learn the broader system behind Mark Yegge's stock analysis, covered-call strategies, trade planning, and disciplined portfolio management.
Explore Cash Flow Machine Elite