
Post-Midterm Stock Market Bounce: History vs. the Charts
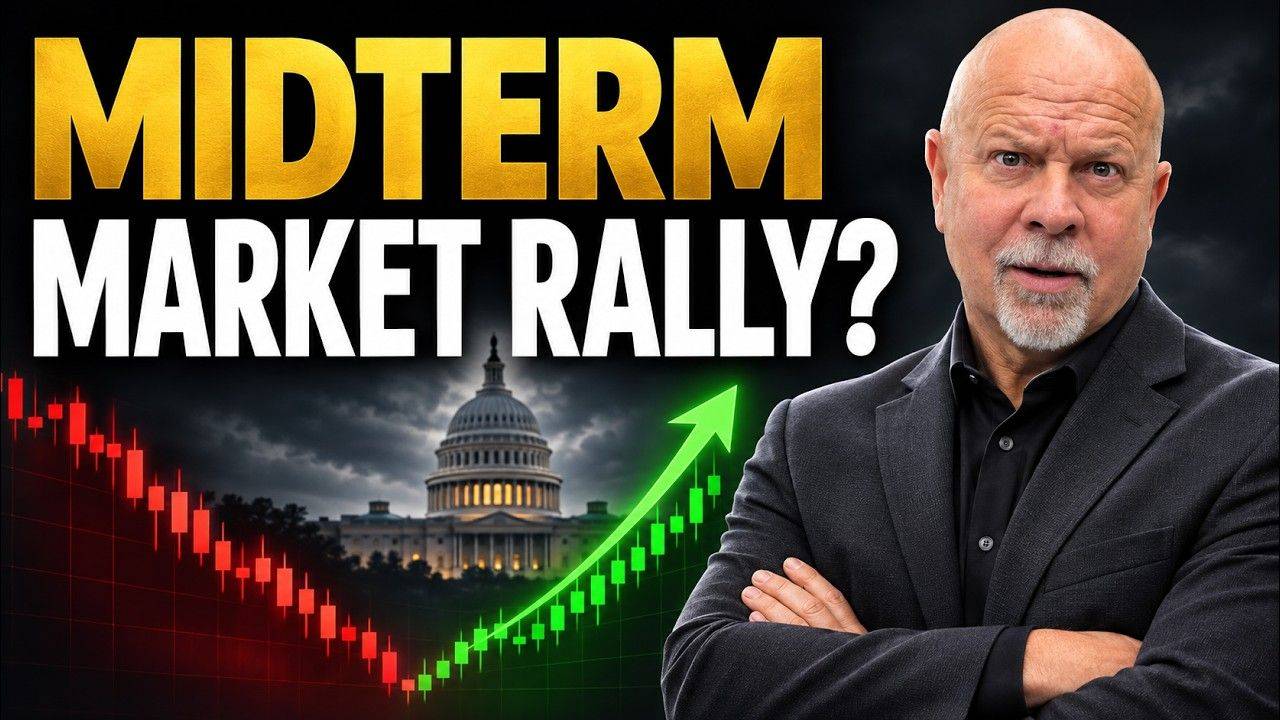
Post-Midterm Stock Market Bounce: Why History Is Bullish—But the Charts Still Need to Confirm
Election night delivered plenty of drama for traders watching the overnight futures. As the midterm results rolled in, the Nasdaq was down sharply—only for the market to reverse course by morning and stage a massive post-election bounce as investors digested the reality of a divided Washington.
In this special Market Pulse report, Mark Yegge examines the tug-of-war between the historical case for a post-midterm rally and the real-time trading case on the charts. While history overwhelmingly favors the bulls over a 12-month horizon, one strong session does not automatically create a sustained uptrend—and disciplined traders need confirmation before getting aggressive.
Key Takeaways
1. Gridlock Fueled a Sharp Reversal
After steep overnight losses in the Nasdaq, markets rallied strongly in the morning as traders priced in a divided government with Democratic congressional majorities and presidential veto power.
2. Post-Midterm History Is Strongly Bullish
Historically, 19 out of 19 twelve-month periods following midterm elections have finished higher, averaging a 15% gain, with fourth-quarter midterm returns averaging roughly 6.6%.
3. Rallies Do Not Always Happen Immediately
Past cycles like 2018 and 1987 show that post-election markets can still experience near-term lows or sharp volatility before longer-term trends play out.
4. AI and Data Centers Face New Headwinds
Political shifts in states like Texas could point to growing pushback against data center expansion, adding another potential headwind to already pressured AI valuations.
5. The Market Remains in a "Yellow" Phase
After five to six months of directionless head-fakes, the market still needs higher lows, higher highs, recovered moving averages, and strong volume to prove a sustained rally.
6. QQQ Is Testing Its 200-Day Moving Average
While QQQ is bouncing off its 200-day moving average, it remains in a five-week downtrend and could still face further downside pressure toward the 663 area into December.
From Election-Night Selloff to Morning Surge: The Stalemate Effect
As election results came in overnight, the immediate reaction in the Nasdaq was decidedly negative. Yet by the opening bell the next morning, sentiment had flipped completely, driving a powerful bounce across the major averages.
According to Mark, the shift came as market participants grew comfortable with the prospect of political stalemate in Washington. With Democrats winning majorities in both chambers of Congress against a president holding veto power, sweeping legislative changes become much harder to pass. While the president will likely rely on vetoes and executive orders to navigate a divided Congress, Wall Street often views gridlock favorably because it reduces legislative surprises. Plus, with the election behind us, campaign noise fades and corporate earnings can begin to take center stage again.
The Historical Case vs. The Trading Case
Mark frames the current environment as a balancing act between two distinct perspectives: what history suggests should happen over the next year, and what disciplined traders actually need to see on the charts right now.
What Midterm History Says Since 1950
- 19 out of 19 Positive Periods: Every 12-month period following midterm elections has finished higher, with every post-midterm year since 1950 ending in positive territory.
- 15% Average 12-Month Return: Investors who stayed in the game during post-midterm periods have historically seen an average 12-month gain of 15%.
- ~6.6% Average Fourth-Quarter Return: The fourth quarter of midterm election years has historically delivered an average return of around 6.6%, alongside solid three-month and six-month follow-through.
Despite that impressive track record, Mark cautions that 19 out of 19 is still a relatively small sample size—and there are never any guarantees in the market. There is always the possibility that this cycle becomes 19 out of 20. More importantly, even when post-midterm years finish higher, the path getting there can be bumpy:
- 2018 Midterm Cycle: Following the November 6, 2018 election, the market did not go straight up. Instead, stocks dropped to a significant low a couple of months later before rallying sharply over the following year.
- 2020–2022 vs. 2023: After a painful bear market ending in 2022, the market staged a strong recovery in 2023 following the midterm elections.
- 1987 Warning: Even in a strong up year that featured an initial bounce, the market still suffered the October 1987 crash.
That is why Mark avoids relying blindly on market clichés like "Sell in May and go away," the "Santa Claus effect," or the "January effect." Every market environment is different. While historical statistics are useful to keep in mind so you do not trade out of fear, the trading case requires waiting for the market to prove itself before jumping in on single-day euphoria.
Why the AI Trade Could Face New Political Headwinds
Beneath the surface of the post-election bounce, Mark points out a shifting dynamic that could weigh on one of the market's biggest themes: artificial intelligence and data center infrastructure.
AI valuations have already been under selling pressure recently. Looking at the election map, Mark notes that a state like Texas shifting blue or purple may signal growing local resistance to massive data center buildouts. If communities and policymakers push back against new data centers, that creates an unexpected headwind for the AI trade. While the recent AI selloff could prove overdone in time, traders must respect the possibility of additional pressure on high-valuation tech names.
Navigating a "Yellow" Market with Covered Calls
For the past five to six months, the broader market has lacked a clear, sustained trend—repeatedly head-faking traders as it flips between yellow, red, and green market signals. Even recent "green" periods have only lasted a couple of days before stalling out.
Right now, Mark views the market as being back in a yellow phase, which typically represents either a choppy recovery or a potential failed bounce. While today's surge shows evidence of buyer demand, Mark anticipates the next couple of months heading into Christmas could remain volatile.
How Cash Flow Machine Traders Play Sideways & Choppy Markets
In directionless markets that whip back and forth, Mark emphasizes using covered calls to generate consistent income whether a stock moves up, down, or sideways—paired with a strict plan to step aside when trends break down and scale back in only when the market confirms strength.
Technical Analysis: What the QQQ Weekly Chart Is Saying
To cut through the political noise, Mark turns directly to the weekly chart of the Invesco QQQ Trust (QQQ), where several critical technical structures stand out:
- Failed All-Time High Breakout: QQQ previously pushed above its all-time high but could not hold the breakout, reversing lower over the past several weeks.
- Five-Week Downtrend: Despite the post-election bounce, QQQ remains locked in a five-week downtrend on the weekly chart.
- 200-Day Moving Average Test: Price action is currently bouncing right off the 200-day moving average, making this a pivotal technical support zone.
- Potential Downside Toward 663: Mark suspects the market could still experience a bit more pain into December, potentially pulling QQQ down toward the 663 level before staging a more durable bounce and bringing sustained buying back into the market.
What Traders Should Watch Now
Higher Lows & Higher Highs
One strong bounce does not make a trend. Watch for price action to form constructive higher lows followed by higher highs to confirm a real trend reversal.
Moving Average Recovery & Breadth
Monitor whether key moving averages that were damaged over the past few weeks can be reclaimed on strong volume and improving market breadth.
QQQ 200-Day MA & the 663 Level
Watch whether QQQ holds its bounce off the 200-day moving average or continues its five-week downtrend toward the 663 area into December.
Disciplined Position Sizing
Have your watchlist ready, start small, never average down, and scale in only as the market proves your thesis right. Do not chase euphoric bounces.
The Bottom Line
With the midterm elections in the rearview mirror, reduced political uncertainty and a divided government have given the stock market an immediate relief bounce. History tells us to prepare for opportunity, as post-midterm years have consistently rewarded patient investors over a 12-month window.
However, Mark's core message is simple: history says to prepare, but the charts tell you when to act. With the market still in a choppy "yellow" phase, AI valuations facing fresh questions, and QQQ in a five-week downtrend testing its 200-day moving average, this is a time for discipline rather than FOMO. Build your watchlist, start small, generate steady cash flow with covered calls, and let price trend, volume, and breadth confirm the next sustained leg higher.
Want to Learn How We Generate Income Regardless of Market Direction?
Discover how the Cash Flow Machine covered call system helps investors collect consistent weekly and monthly income whether stocks move up, down, or sideways. Watch our free masterclass to see the rules-based framework in action.
Watch the Free MasterclassSerious Investors Join Us Inside Elite
Ready to master the complete Cash Flow Machine methodology? Inside Elite, Mark Yegge teaches the full step-by-step system for reading market signals, selecting stocks, managing risk, and building repeatable portfolio cash flow.
Explore Cash Flow Machine Elite