
Insider Tips - Weekly Stock Market Report - Week November 09, 2026
Insider Tips — November 09, 2026
Post-election volatility hit the stock market with full force this week, producing one of the ugliest single-day selling candles since the 2020 pandemic crash and the 2004 market cycle. After an initial post-election pop, sellers stepped in aggressively as investors began digesting the implications of shifting Democratic political leadership and what evolving policy priorities could mean for different corners of the economy. Even though equities staged a rebound the following session, experienced traders recognize that a single bounce after a historic breakdown bar is often a dead-cat bounce rather than an all-clear signal.
The biggest risk right now is treating this selloff like a clearance sale and rushing in to buy falling technology leaders without chart confirmation. High-profile growth stocks with strong fundamentals are gapping lower on heavy institutional volume, and holding onto broken charts without downside protection can quickly turn into a 25% loss or years of dead money. Conversely, the biggest opportunity lies in recognizing that institutional capital is not leaving the market altogether—it is rotating out of technology and energy and flowing directly into constructive setups in the medical and retail sectors.
Technical Analysis
Stepping back from daily headlines to examine our market timing indicators inside Cash Flow IQ reveals a decidedly cautionary environment. Across the board, the charts are dominated by yellow and red signals with almost no sustained green in sight.
The Total Market Index (VTI) printed a massive wide-range distribution candle yesterday—easily one of the sharpest single-day selloffs in the past two decades. Our timing indicator on VTI sits in a cautionary yellow state after cycling between red and yellow for weeks. A breakdown candle of this scale represents real institutional selling that must be respected regardless of short-term rebounds.
The Dow Jones Industrial Average (DIA) tells a slightly more resilient story than the growth indexes, but it has also slipped into a yellow cautionary phase. Beneath the surface, the Dow is flashing four internal red warning lights alongside its own heavy reversal bar, indicating that the index likely wants to probe lower before establishing a durable floor.
The Invesco QQQ Trust (QQQ) remains the epicenter of the market’s technical damage. Our timing model moved to caution on the QQQ back on October 14, and price action has trended steadily lower ever since. Yesterday’s wide-spread down bar extended that streak to 15 consecutive trading days in a red market signal, confirming heavy institutional distribution across large-cap technology.
Finally, the S&P 500 (SPY) sits in a yellow cautionary state while flashing four internal red lights. Historically within our framework, three yellow phases that fail to reclaim upward momentum roll back into a full red signal. Even with an intraday bounce, the benchmark index has significant overhead repair work ahead before buyers regain control.
Market Trends I’m Calling Out
Post-Election Sector Rotation Into Medical and Retail
Market participants are actively repositioning portfolios as they anticipate legislative shifts that could restrict certain industries while favoring others. Rather than sitting entirely in cash, institutional money is rotating out of technology—and trimming energy exposure—while flowing into healthcare and consumer retail. Our industry group rankings currently show mortgages in the number-one spot, closely followed by medical diagnostics and research, medical instruments, broader healthcare, and select pockets of software.
Avoiding the "Dead Money" Trap
One of the most expensive mistakes investors make during a sector transition is identifying strictly as a tech investor and sitting on lagging stocks for two years waiting for growth to return. Successful investing requires adapting to make money in all market environments. Leaving capital tied up in broken technology charts means missing the emerging leadership bases forming in healthcare and retail right now.
Fundamentals vs. Price Action ("Respect the Red")
This week offered a stark reminder that a company’s fundamental growth metrics and its stock chart can tell two completely different stories. A company can post phenomenal double- and triple-digit earnings growth across the board and still suffer a sharp breakdown when institutions reduce exposure. Enforcing trailing stops and circuit breakers is the only way to ensure a routine correction never turns into a major drawdown.
Individual Stocks (What I’m Seeing)
Apple (AAPL)
Apple stands out as one of the few bright spots in technology. Following a well-received earnings report, the stock staged a buyable gap up and is holding firmly inside its buy zone while the rest of tech struggles. Holding up during broader sector weakness is a classic sign of future leadership, and with our proprietary Genius Strength Indicator trending upward, Apple looks poised to lead once the market turns green.
Nvidia (NVDA)
Nvidia illustrates why chart action always outweighs fundamental headlines. Despite phenomenal double- and triple-digit fundamental growth numbers, the chart shows widening price spreads and heavy distribution after a high-volume breakout near 243 failed. Shares dropped 60 points—a 25% tumble down to 181—underscoring why trailing stops and circuit breakers are vital. Yesterday’s massive-volume gap down pushed its Genius Strength rating down 20 points to 26 out of 99 and broke support, putting the 163 level back in play.
AP
Bucking the broader market slump, AP erupted higher by 72% this week on volume running 165% above its daily average. On the daily chart, shares gapped cleanly above the 50-day moving average alongside a rising strength indicator. While the stock will likely need sideways consolidation as early buyers take profits, its institutional volume signature is impressive.
Tesla (TSLA)
Tesla continues to struggle after failing across three attempts to reclaim its 498 all-time high. Consecutive gap-downs culminated in yesterday’s selloff on volume running 110% above average. Although shares bounced today, volume ran just 6% to 8% above average—showing weak conviction after slicing through 345 support and leaving 297 in play.
SpaceX
After peaking near 160–161, SpaceX gapped down on heavy volume below its 50-day moving average—a clear exit signal since little good happens beneath the 50-day line. However, the stock completed an ABCD downside pattern yesterday and is filling its gap today on volume 34% above its 50-day average, putting it back on the watchlist pending a stronger accumulation candle.
Abercrombie & Fitch (ANF)
Leading the retail rotation, Abercrombie & Fitch gapped up on strong volume after last quarter’s earnings and carries a 96 Genius Strength rating. Shares are forming a ripening base just below their ideal buy point, making ANF a top retail watchlist candidate once it reclaims its pivot.
Macy’s (M)
Macy’s is beginning to work up the right side of its pattern as money rotates toward retail, though the setup remains slightly early. Shares are pulling back on rising volume and look poised to test and potentially bounce off the 50-day moving average.
Starbucks (SBUX)
Viewed as a consumer and restaurant retailer, Starbucks displays a constructive chart structure similar to its retail peers. A modest pullback with the market has brought shares right back into a fertile buy zone, offering a secondary window to evaluate an entry.
Kroger (KR)
Highlighted on our Cash Flow IQ "Fresh Bases" screener, Kroger is carving out a long, steady cup pattern. Price action is climbing the right side of the cup, confirming steady institutional accumulation in defensive retail.
Eli Lilly (LLY)
At the forefront of the medical trade, Eli Lilly recently broke out of a fresh plus base before market weakness pulled it back into its buy zone today. High-quality leaders frequently offer a second chance after an initial breakout, making Lilly a prime healthcare setup to watch.
Gilead Sciences (GILD)
Operating alongside Eli Lilly in healthcare, Gilead consolidated for a month in a textbook cup-with-handle pattern before staging a powerful gap-up breakout. After rallying strongly, shares are pulling back constructively and may soon offer a secondary entry point.
Dollar Tree (DLTR)
Representing discount retail, Dollar Tree formed a clean cup pattern and broke out before recent market selling pushed it slightly back below its pivot. The base structure remains intact, earning it a spot on our retail watchlist.
Key Takeaways
- Respect Cautionary Signals: With VTI, SPY, and DIA in yellow states and QQQ red for 15 straight sessions, avoid buying dips blindly.
- Don't Chase Single-Day Bounces: Rebounds after historic breakdown candles require follow-through volume and repaired moving averages before they can be trusted.
- Follow Institutional Rotation: Money is actively flowing out of technology and energy and rotating into medical, healthcare, and consumer retail stocks.
- Separate Fundamentals From Charts: Even elite earners like Nvidia can drop 25% when support breaks—always use trailing stops and circuit breakers.
- Avoid Holding "Dead Money": Staying stuck in broken tech charts ties up capital that could work in emerging medical and retail leaders.
- Prioritize Relative Strength: Focus your watchlist on stocks holding buy zones or building right-side bases, including Apple, Eli Lilly, Abercrombie & Fitch, and Kroger.
Current Market Condition
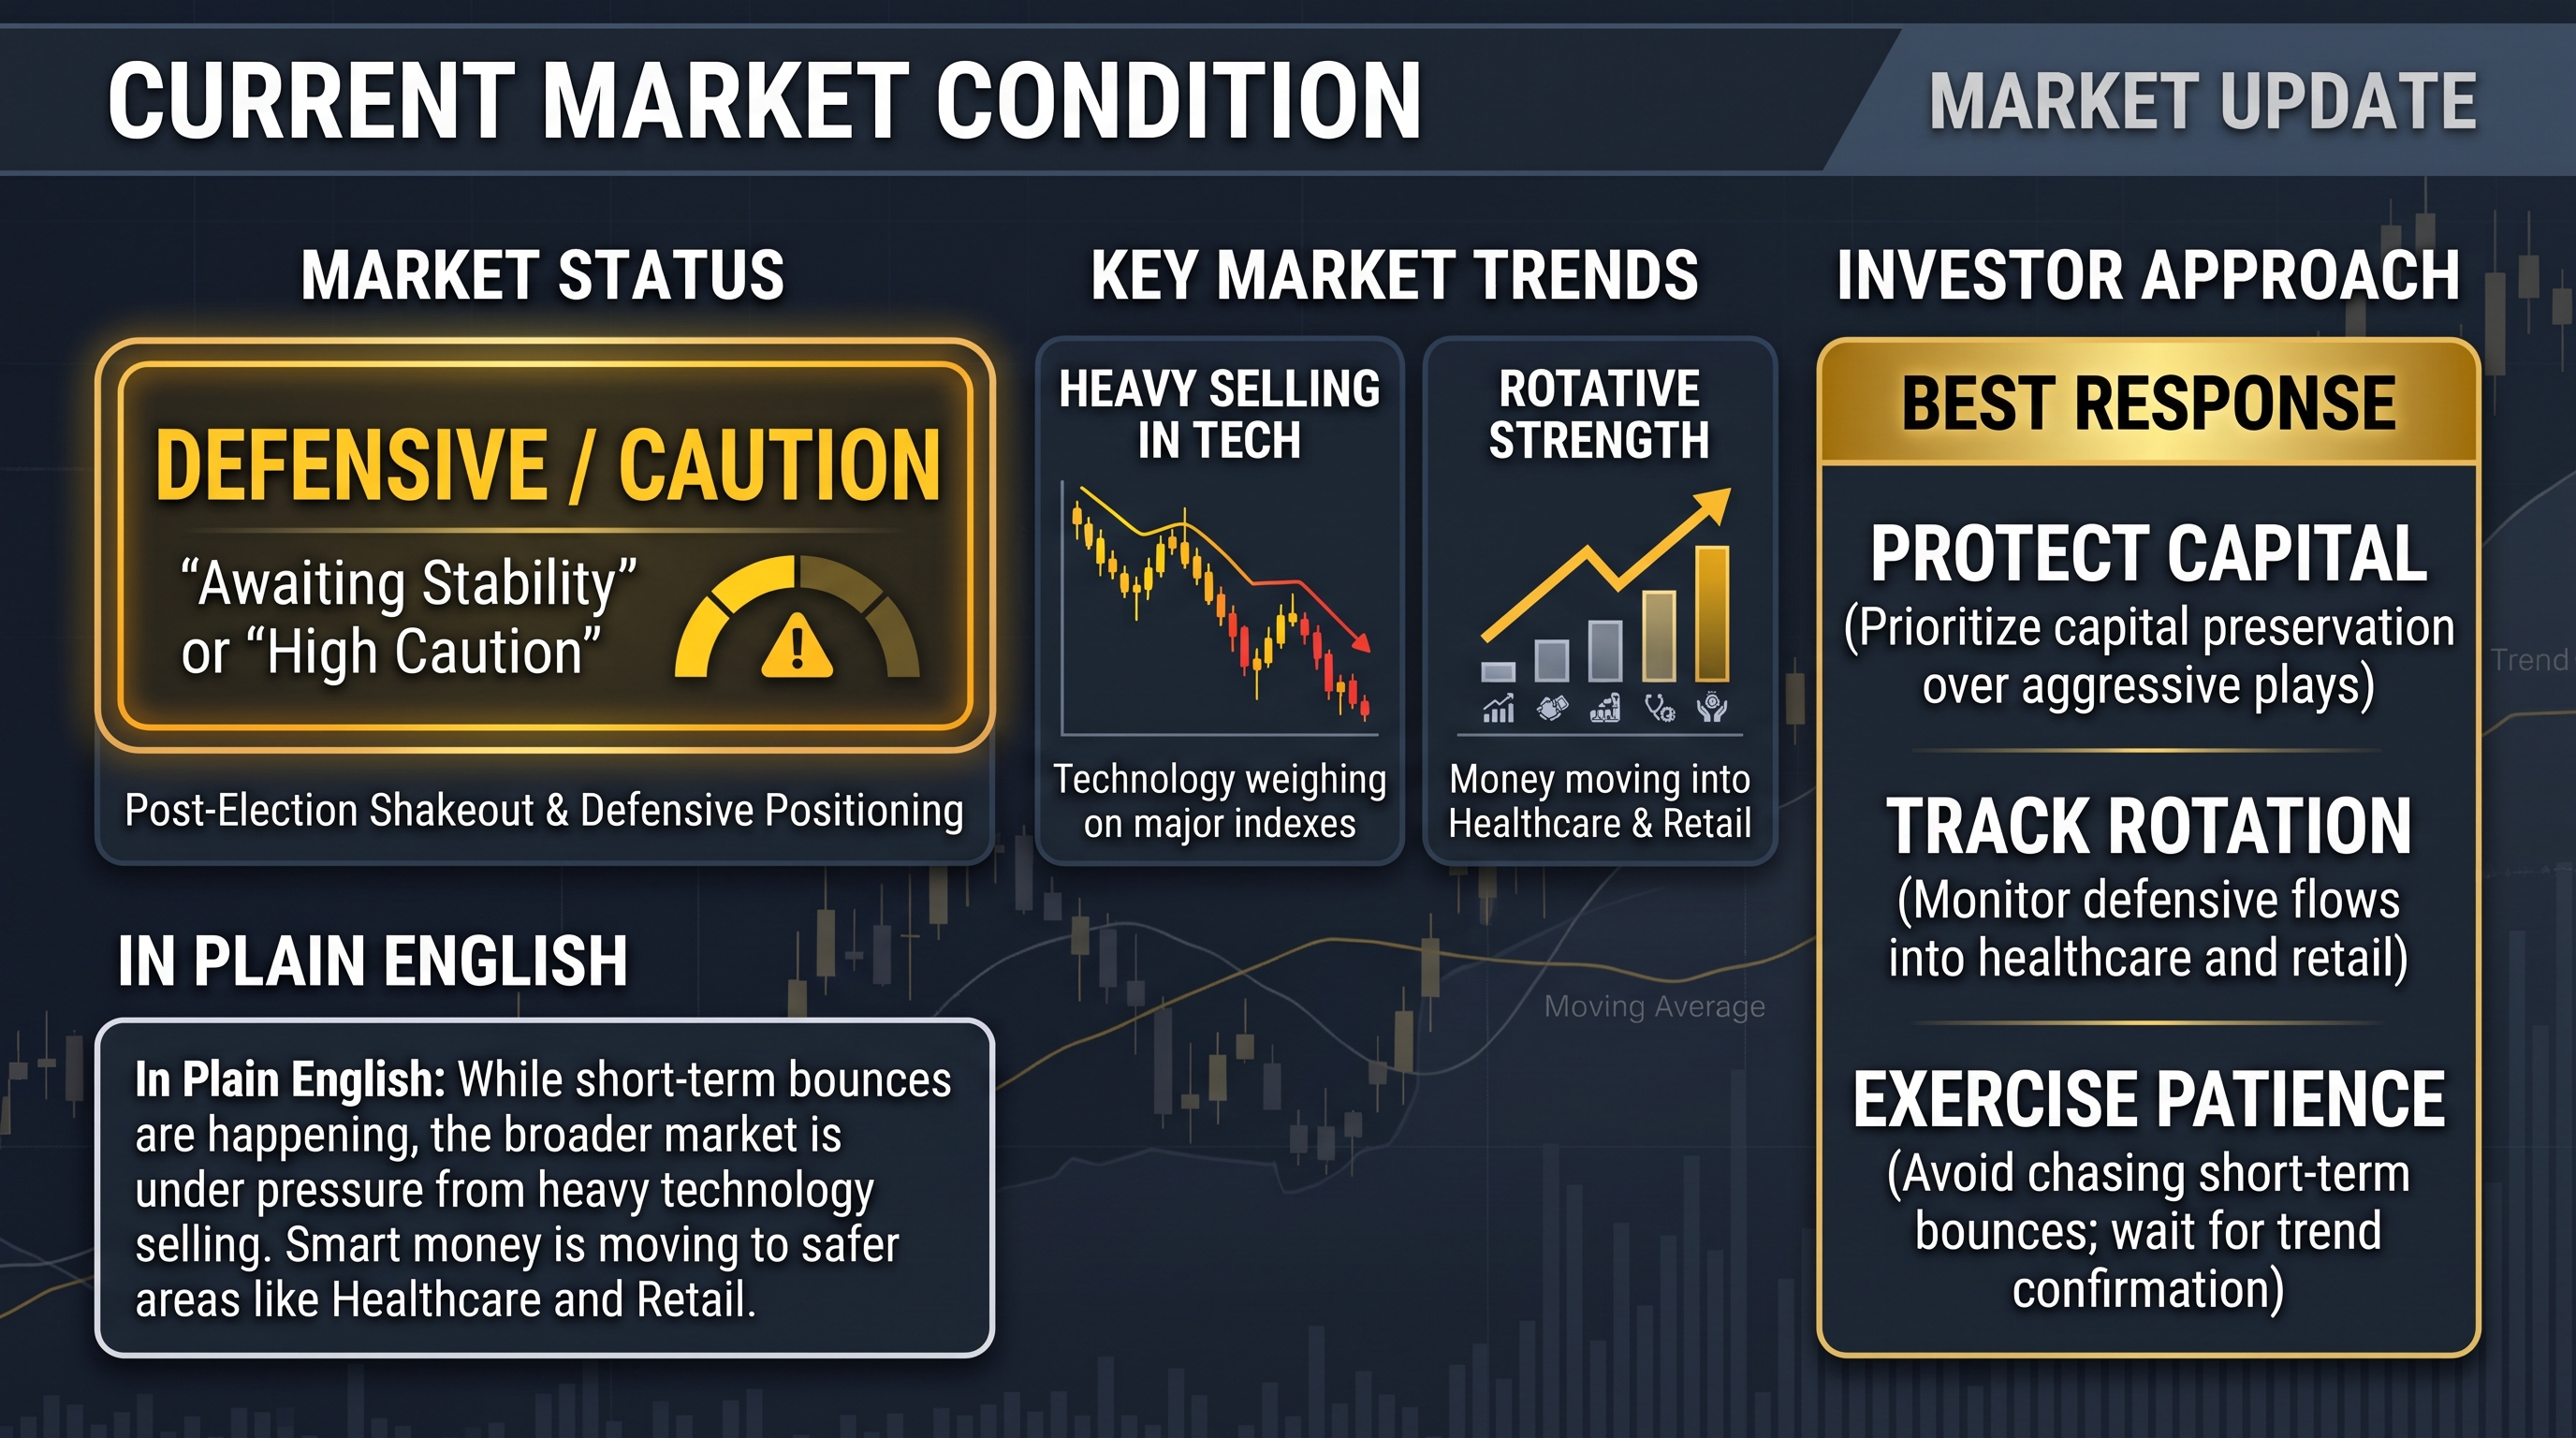
The market remains in a defensive, cautionary state following a sharp post-election shakeout. While short-term bounces are occurring, heavy selling in technology continues to weigh on the indexes, and disciplined investors are protecting capital while tracking money rotating into healthcare and retail.
Conclusion
Navigating a volatile post-election market requires discipline, patience, and strict risk management. You do not need to predict policy outcomes or catch the exact bottom of a selloff to succeed. By honoring your stop-losses, respecting red and yellow signals, and refusing to chase unconfirmed bounces, you preserve your capital while others get whipsawed. Use this cautionary phase to tighten your risk controls and prepare your watchlist around the medical and retail setups showing real institutional support—so you are ready to act when the charts confirm strength.
Stock Tips This Week
Post-Midterm Stock Market Bounce: Why History Is Bullish—But the Charts Still Need to Confirm
In this video, Mark Yegge contrasts the bullish history of post-midterm election years—up 19 out of 19 times since 1950—with current technical headwinds. With the market in a choppy "yellow" phase and QQQ testing its 200-day moving average in a five-week downtrend toward 663, investors should avoid chasing single-day bounces, generate steady income with covered calls, and wait for confirmed higher highs and strong volume before scaling in.

Covered Call On Medical Devices ETFs Innovation Cycle Exposure
In this blog, you will learn how to generate consistent option income by writing covered calls on established medical device ETFs like IHI, XHE, and MDYV rather than speculating on volatile biotech stocks. By selling two-to-four-week calls ahead of predictable FDA, earnings, and conference catalysts—while capping sector exposure at 15% to 25%—investors can pair healthcare's recurring revenue stability with elevated, steadily compounding option premiums.

Covered Call Portfolio Diversification Across Sectors And Expirations
In this blog, Mark Yegge applies lessons from the 2008 financial crisis to show how diversifying across three to five uncorrelated sectors (capped at 25% each) and staggering expirations builds a resilient covered call portfolio. By tailoring strike selection to each sector's volatility profile and laddering weekly, monthly, and quarterly cycles, income investors eliminate third-Friday gamma crunches and keep weekly cash flow arriving even during sector downturns.
Podcast Episode This Week

Episode 200: Protect Your Money This Week
In this milestone episode of the Wealth Architect Podcast, Mark Yegge examines why stocks, Bitcoin, gold, and AI are moving in tandem under inflation and interest rate pressures. Rather than trying to time the market, he outlines how to survive volatile swings and avoid forced liquidations by building a resilient foundation focused on consistent cash flow, true asset diversification, and proactive downside protection.
