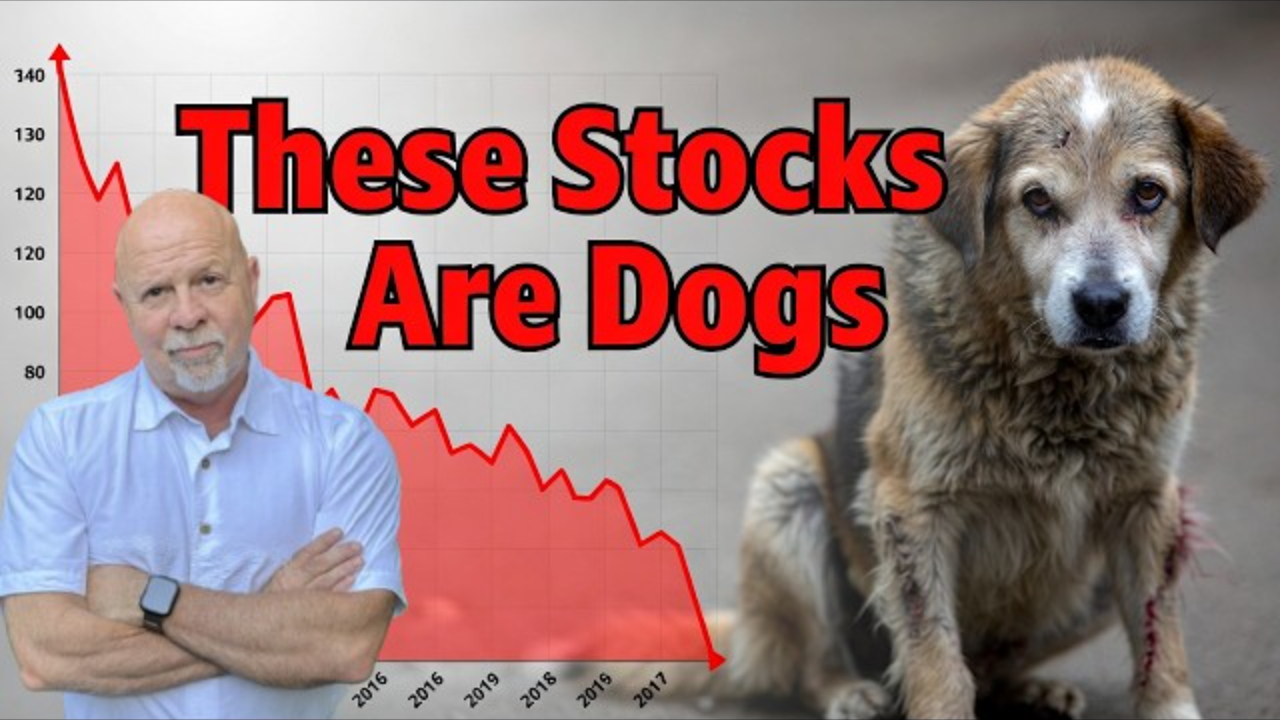
5 Once-Great Stocks That Turned South: Warning Signs Every Trader Must Learn Before It’s Too Late
There’s an old investing lesson that never loses relevance:
If you don’t study the past, you’re likely to repeat costly mistakes.
Many stocks that once looked unstoppable eventually collapsed — not overnight, but through a series of clear warning signals. Traders who ignored those signals often rode their positions all the way down, believing the company would eventually recover.
In this analysis, we’ll examine five well-known stocks that once showed massive growth but later entered serious downtrends. More importantly, we’ll focus on the technical and fundamental warning signs that investors should watch for when a stock begins to lose strength.
Why Studying Failed Stock Leaders Matters
Investors tend to focus only on success stories — stocks that skyrocketed. But long-term success comes from understanding how winning stocks eventually fail.
Common reasons include:
- Slowing earnings growth
- Increased competition
- Technological disruption
- Loss of market leadership
- Institutional selling pressure
- Technical breakdowns on charts
Learning to recognize these signals early helps protect capital and avoid emotional decision-making.
Stock #1 – PayPal (PYPL): From Market Leader to Round Trip Decline
PayPal was once a massive growth story, climbing from around $30 to nearly $300. However, strong historical performance doesn’t guarantee future success.
Key Warning Signs:
- Earnings growth flattened significantly
- Relative strength dropped sharply
- The chart formed bearish technical patterns
- High-volume selling appeared
A major lesson here is the “round trip” — when a stock rises dramatically and then gives back most of its gains. Investors holding onto past success often ignore current performance deterioration.
Stock #2 – Netflix (NFLX): Growth Slowing and Competition Rising
Netflix experienced explosive growth early on, but later faced several challenges:
- Slowing earnings growth
- Increased competition from streaming platforms
- Rising subscription fragmentation
- Technical breakdown near key support levels
Charts began showing heavy overhead supply — meaning many investors were waiting to sell if the stock bounced. This creates resistance that limits recovery potential.
Stock #3 – ServiceNow (NOW): AI Disruption Changing the Industry
ServiceNow once demonstrated powerful upward momentum, but signs of trouble emerged:
- Rapid technical breakdowns
- “Death cross” moving average patterns
- Sharp price declines with heavy selling
- Industry disruption from AI technologies
Even companies with continued revenue growth can see stock prices fall when markets anticipate future challenges.
Stock #4 – Salesforce (CRM): Losing Technical Strength
Salesforce was a favorite growth stock for years, but eventually:
- Price fell significantly below key moving averages
- Support levels failed repeatedly
- Large institutional selling appeared
- Technical breakdown patterns emerged
One of the strongest warnings came when the stock failed to recover after breaking below its 50-day moving average — a signal that long-term momentum had weakened.
Stock #5 – Roblox (RBLX): Hype vs Reality
Roblox attracted strong investor enthusiasm but faced several structural problems:
- Weak earnings trends
- Failed breakout attempts
- Death cross formation
- Multiple bearish chart patterns
- Declining industry strength
The stock also demonstrated “memory” — previous resistance levels prevented upward momentum and triggered selling pressure.
Major Technical Warning Signs Traders Should Watch
Across all five stocks, several recurring signals appeared:
- Dreaded “H” Pattern Formation
This chart structure often signals downward continuation.
- Death Cross Moving Average Signals
When shorter moving averages cross below long-term averages, momentum shifts bearish.
- High-Volume Selling
Institutional investors exiting positions often cause major trend reversals.
- Earnings Growth Slowdown
When growth companies lose momentum, valuations compress rapidly.
- Failure to Hold Key Support Levels
Once major support breaks, stocks often enter prolonged downtrends.
Life Improving Tips for Investors and Traders
- Separate Company Reputation From Stock Performance
A great company does not automatically make a great stock investment.
- Use Stop-Loss or Circuit Breaker Rules
Having predetermined exit criteria helps remove emotional decision-making.
- Avoid Trying to Catch Falling Knives
Bottom fishing during heavy downtrends often leads to deeper losses.
- Respect Institutional Money Flow
Large-volume selling usually signals major investors exiting positions.
- Focus on Capital Preservation
Protecting profits is just as important as generating gains.
Frequently Asked Questions (FAQs)
Q1. Can strong stocks recover after major declines?
Some do, but many enter long-term consolidation phases. Recovery is never guaranteed.
Q2. What is a death cross?
A bearish technical signal where a shorter-term moving average crosses below a longer-term moving average.
Q3. Should investors buy stocks after large price drops?
Only after confirming trend reversals and improved fundamentals.
Q4. Why do once-great stocks fail?
Competition, technological disruption, leadership changes, and slowing growth are common factors.
Q5. What is overhead supply?
Investors who bought at higher prices may sell when prices rise again, creating resistance.
Call to Action
If you want to become a smarter trader and avoid costly mistakes:
- Learn to recognize technical warning signs early
- Study historical stock failures — not just success stories
- Focus on finding stocks at the right spot on the chart
- Build disciplined trading systems with risk management rules
Structured training programs, trading challenges, and advanced chart-reading education can help you develop consistent strategies and improve long-term results.
Conclusion
Stocks like PayPal, Netflix, ServiceNow, Salesforce, and Roblox were once market darlings. Their declines show that no company is immune to competition, disruption, or changing market sentiment.
Successful investors don’t rely on past performance — they rely on current data, technical signals, and disciplined exit strategies. By recognizing warning signs such as slowing earnings, failed technical levels, institutional selling, and bearish patterns, traders can protect their capital and avoid devastating losses.
In the end, investing success is less about finding the next big winner and more about avoiding preventable mistakes. Study the past, listen to the charts, and always prioritize risk management over emotion.
