Insider Tips - Weekly Stock Market Report - Week October 20, 2025
Insider Tips for October 20, 2025
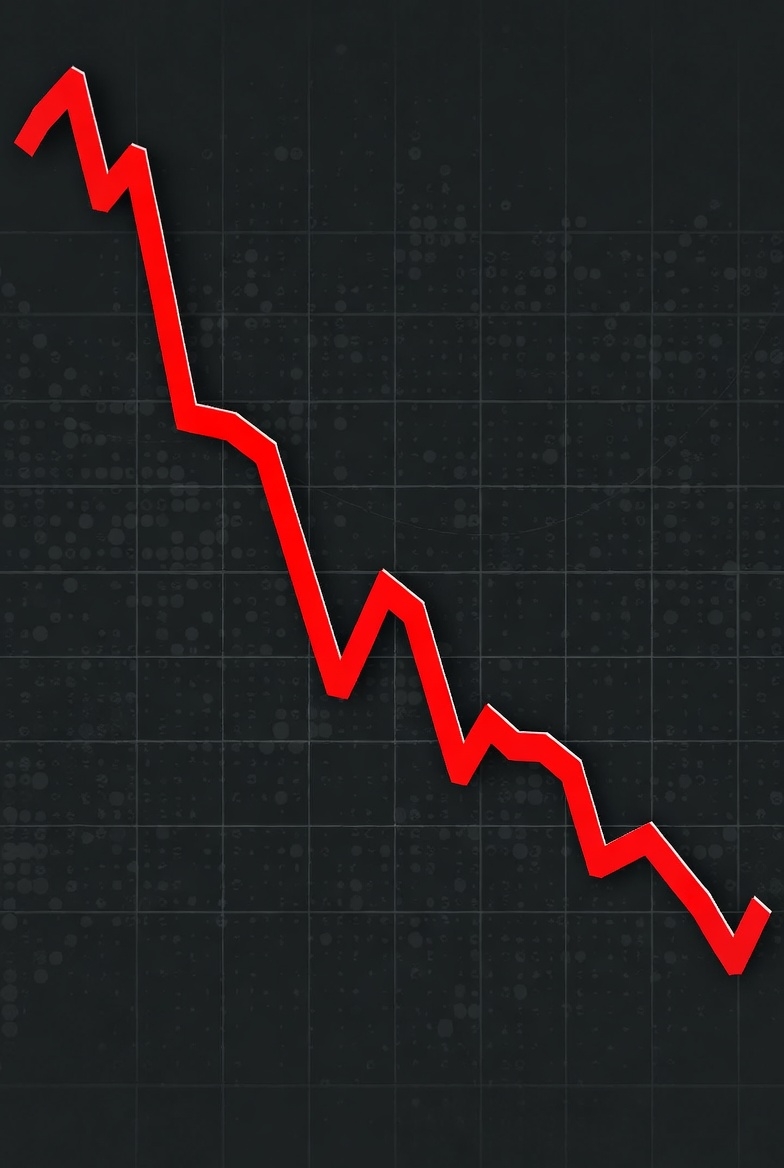
📉 Red, Rough, and Rolling Over
This week’s Insider Tips is all about caution. The market has shifted decisively into red territory with all four of our key indicators flashing warnings. Breakouts are failing, volatility is rising, and panic is starting to creep in. I’ve moved most of my portfolio to cash, because as I always say, “It’s better to be out of the market wishing you were in than in the market wishing you were out.” While a government shutdown and political noise dominate headlines, the real story is technical: momentum has stalled, major indexes are rolling over, and leading stocks are struggling to break out. Right now, defense is the name of the game.
🧭 Full Market Breakdown
🧨 Macro Overview & Sentiment
We’re now firmly in a red market — four red signals confirm that the easy-money, straight-up environment we enjoyed since April has ended. The government shutdown may grab attention, but it’s mostly noise. What matters is that price action has turned bearish: stocks are struggling to break out, rallies are failing, and institutional selling is visible under the surface. The “punch in the mouth,” as Mike Tyson would say, has arrived.
Investor sentiment has shifted dramatically. The VIX spiked close to 30, a clear sign of fear and forced selling. Although it’s cooled slightly, that spike is a warning shot — investors are de-risking and moving capital to the sidelines. Volatility is back, and with it comes choppiness, whipsaws, and sharp reversals.
📊 Technical Analysis – Major Indexes
-
NASDAQ Composite: A large, high-volume down candle last week marked the turning point. The index remains stuck within that range, signaling distribution and potential topping action. It will take significant buying power to reclaim previous highs.
-
S&P 500: Rebounded off the 50-day moving average but shows signs of rolling over.
-
Dow Jones Industrial Average: Sharp breakdown candle still dominates the chart — price action remains weak.
-
NYSE Composite: Similar pattern — all major indices are trapped beneath key resistance levels.
The takeaway: momentum has broken. Until the indexes reclaim those breakout levels, rallies should be viewed skeptically.
📉 Volatility & Risk Metrics
-
VIX (“Fear Index”): Spiked near 30 — its highest level in weeks — indicating a surge in market anxiety. While it has eased slightly, the heightened volatility suggests more downside or sideways action ahead.
-
Market Breadth: Deteriorating rapidly. Even strong names are failing to break out, and many leadership stocks are rolling over.
📈 Individual Stock Highlights
✅ Relative Strength Leaders (But Still Risky):
-
Apple (AAPL): Holding up relatively well in a first-stage base. As long as it stays above the 10-week moving average, it’s okay — but upside is limited without broader market support.
-
Nvidia (NVDA): Long consolidation pattern. A breakout is unlikely unless the market improves or earnings blow expectations away.
-
Tesla (TSLA): Up ~21% since breakout but now consolidating before earnings. Caution: even strong results could trigger a selloff in this environment.
⚠️ Breakdown & Weakness:
-
MicroStrategy (MSTR): Classic “death cross” — now trading below both 50- and 200-day moving averages. Heavy selling pressure likely due to rotation into gold.
-
iShares Bitcoin Trust (IBIT): Two weeks of heavy selling, breaking below its base. Likely to test the 200-day moving average.
-
Palantir (PLTR): Late-stage base and now ~4% off the pivot. Late-stage bases are risky in weak markets.
🚀 Strong Momentum Names (But Wait for Better Conditions):
-
Robinhood (HOOD): At all-time highs with 98 relative strength. Despite strong performance, avoid initiating new positions in a red market.
-
AppLovin (APP): Massive run from ~$420 to ~$750. Mark exited in the $600s. There’s a gap near $500 that could attract price action.
🏭 Sector Trends & Industry Strength
The most notable rotation is in semiconductors, which climbed from near-bottom (#193 of 197) six months ago to now #7. Nvidia leads this resurgence. However, sector strength means little if the broader market remains under pressure — leadership often breaks last in a correction.
📌 Key Takeaways
-
✅ All four signals are red — we are in a confirmed downtrend.
-
⚠️ Volatility is spiking and institutional selling is visible.
-
🧯 Defense > offense: Scale back exposure, raise cash, and focus on capital preservation.
-
📉 Even strong names struggle in weak markets — avoid chasing breakouts.
-
💡 “Let the market prove it deserves your money.” Wait for green signals before redeploying capital.
🧭 Conclusion
We’re officially in a risk-off environment. While it’s tempting to hunt for bargains or chase strong names, the reality is that the market is telling us to step back and stay patient. Volatility, failed breakouts, and weakening breadth are classic signs of a correction. Remember: it’s better to miss the first 5% of a new uptrend than lose 20% trying to catch a falling knife.
I’m staying mostly in cash and waiting for the market to prove it’s ready for my capital. There will be better opportunities — but this isn’t one of them.
Current Market Condition:
We’re now fully in a red market, with all four major signals flashing red and momentum clearly broken. Breakouts are failing, rallies are stalling, and institutional selling is showing up across the board. Volatility has spiked — with the VIX nearing 30 — as fear creeps back into the market and money moves to the sidelines. Major indexes like the NASDAQ and S&P 500 are rolling over and trapped beneath key resistance levels, while even strong stocks are struggling to gain traction. In short, this is a risk-off environment where caution and capital preservation should take priority until the market proves it’s ready to turn around.
💸 The 4-Step Cashflow Blueprint: Step 1 — The Right Stock

💸 The 4-Step Cashflow Blueprint: Step 1 — The Right Stock
If you want to create predictable, reliable income from the stock market, it all starts with one foundational step: owning the right stock. Everything else — market timing, chart analysis, income generation — is built on this decision. Without it, the rest of the process is on shaky ground.
Most investors get this wrong. They chase headlines, tips from friends, or so-called “cheap” stocks hoping for a big payday. Others try to time the next breakout company without understanding the underlying business. This kind of speculation might occasionally work, but more often than not, it leads to disappointment and losses. In the Cash Flow Machine system, we flip that mindset entirely — our priority is to protect capital first, then generate income second.
🏰 Building Your Fortress
I like to think of this step as building your fortress. A fortress stock is a high-quality, battle-tested company with a strong business model and institutional support. These companies form the foundation of a portfolio designed to generate steady cash flow — and they make the covered call strategy far more effective and sustainable.
Here’s what we look for:
-
📈 Consistent Growth: Companies with strong, predictable revenue and earnings growth. This is a sign that the business is executing well and attracting investors over time.
-
💼 Institutional Support: Heavy trading volume and widespread ownership by large funds or institutions. When big money is behind a stock, it tends to support the price and absorb selling pressure.
-
🔁 Innovation & Leadership: Companies that consistently innovate and adapt — launching new products, expanding into new markets, and led by visionary management teams.
-
📊 Liquidity & Option-Friendly: Stocks that trade with tight bid/ask spreads and active option chains. Liquidity means you can enter and exit positions easily and sell covered calls efficiently.
And perhaps the most important factor of all: the stock’s price action should generally move from the lower-left to the upper-right on a long-term chart. That’s a visual way of saying the trend is up. Even if the stock doesn’t skyrocket, a steady upward trend increases the probability that our income strategies will work consistently.
❌ What to Avoid
This is where most investors go wrong: they chase speculative names — the latest biotech with “potential,” the penny stock someone mentioned online, or the flavor-of-the-month meme stock. These companies often lack real fundamentals, institutional support, or long-term staying power.
Yes, they might 10x. But they’re far more likely to crash 70–90%, wiping out months (or years) of gains. And when that happens, the income you’re trying to generate through covered calls disappears too. The foundation collapses.
We’re not trying to hit home runs. We’re trying to collect steady paychecks from reliable companies while we sleep. That’s what fortress stocks allow us to do.
📋 Your Next Step
Now it’s your turn. Start by creating a watchlist of 5–10 companies that fit the fortress criteria. These should be businesses you understand — household names with strong balance sheets, growing earnings, and real products or services.
From there:
-
Pull up their charts and look for a steady, upward trend.
-
Check trading volume and ensure options are liquid and active.
-
Review fundamentals like revenue growth, earnings per share, and return on equity.
Once you’ve narrowed it down, you’ll have a shortlist of companies that can serve as the engine of your income strategy — the bedrock on which the rest of the Cashflow Blueprint is built.
🔜 Coming Next Week: Step 2 — The Right Market. Even the best stock will struggle if the overall market is moving against you. I’ll show you how to identify powerful tailwinds and align your strategy with market momentum to dramatically increase your probability of success.
